Study Reveals Unsettling Data About How Fat We've Gotten Over the Past 40 Years. Plus: Macronutrient Analysis of the Diets of Leanest & Fattest Yields Surprising Results
 |
| Man, the 70s that was a time! A time, when the average American still had a 20% lower BMI, being normal weight was still the norm and models like those in the photo above did not have to be anorexic. |
Let's take a look at data
I am actually not sure where to start with my detailed recapitulation of the data, but I guess there is no direct causal relationshipp between the decline of marriage rates (75%-57.5%; averages) from the early 1970 to the early 2000s that's to blame, so that's probably not the best starting point. In fact, if you look closely, the trigger must be somewhere in the late 1980s, early 1999, where the BMIs literally exploded andthe number of "lightly" obese individuals previously hovering around at 7% doubled - a timpoint at which the decline in marriage rates from the late 1970s was already over and the marriage rates remained more or less stable, by the way ;-)
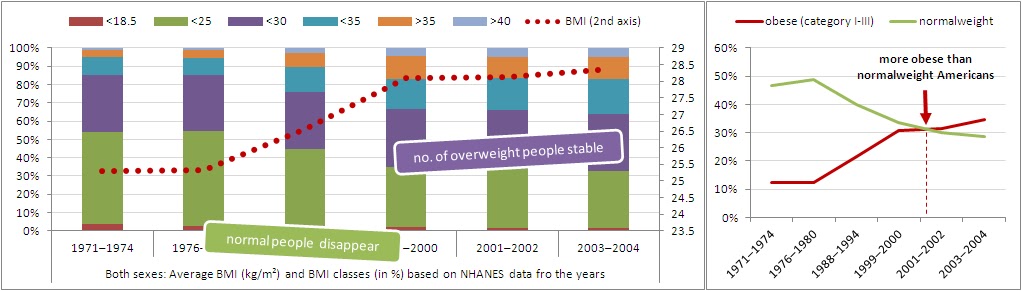 |
| Figure 1: Mean BMI (kg/m²; right axis) and BMI class (values in %, BMI classes from <18.5kg/² = underweight to >40kg/m² = morbidly obese; left axis) development in the US; data based on averages calculated based on NHANES data from men and women (Yancy. 2013) |
You can of course still argue that by adding the overweight Americans to the equation the obese US boys and girls would be a minority again, but the simple fact that the number of overweight individiuals remained constant while the number of normalweight Americans was constantly declining tells you that being overweight is nothing but a transient state from normal to obese, these days. It's nothing people will remain in for their whole life - in most cases probably not even for more than one or two years, although many are trying hard to change things.
 |
| Figure 2: While more and more US men and women say that they are trying to lose weight (left), the average American keeps eating more and more every year (Yancy. 2013) |
People love it, but is it really true, "calories don't count"?
It's as easy as the pie that's going down your piehole: At the end of the day, calories do count and magic pills and single-sided diets are not going to save "the average American" from drowning in his / her own blubber, if he / she does not accept that "super-size meals" generate "super-size people". On the other hand, the current understanding that differences in the +/- 100kcal would make a significant difference, is intrinsically flawed, scientifically not sustainable and totally disregards the importance of what you eat, how (not how much) you exercise, how and how much you sleep, how much stress you have and so on and so forth... Unfortunatelythe majority 2000-2004 NHANES cohorts of US citizens did not make the good food choices, do the concomitant strength and cardio workouts, are almost anal about their sleep hygiene and keep a constant eye on their stress levels that would allow them to get away with eating constantly 10% more than their predecessors in the 1971-1974.
 |
| Figure 3: Changes in macronutrient composition of "the American diet" (Yancy. 2013) |
"In men, the proportion of total energy intake from carbohydrate declined with increasing BMI category (46.6 % in underweight/normal weight to 45.5 % in obese class II/III, P<0.01 for trend), after adjusting for survey period and other variables. In women, the decline across BMI classes was slighter (0.4 percentage points) but still statistically significant (P<0.01 for trend)." (Yancy. 2013)The opposite goes for the trends for fat intakes, which are positive with the leanest getting the least amount of their daily energy requirements from fat. Needless to say that the NHANES data does not tell us, where these fats and carbohydrates came from. Still the scientists kick of their conclusion stating that:
Actually the researchers could have concluded their paper right here, if their own differential analysis had confirmed what appears to follow naturally from the above, namely that those who are the fattest will eat the most carbs and the least fat. That's however not the case. And if this was not already paradoxical enough, the obese individuals "reported" consuming an overall lower amount of energy, as well. So, ..."From 1971 to 2004 in the USA, daily energy intake and the percentage of daily energy from carbohydrate increased substantially, whereas the percentages of daily energy from fat and protein declined. These results are consistent with a prior study that did not adjust for the full set of demographic, health status, physical activity and dietary behaviour variables considered here (Austin. 2011). The types of foods that explain these changes in macronutrient composition in the American diet were not a focus of the present study, but previous research has demonstrated that intakes of sugared beverages and fast foods increased substantially over the time period of the surveys (Nielsen. 2003) . The decline in percentage of daily energy from fat may indicate that the US population altered dietary intake in response to the USDA’s messages to reduce dietary fat. Unfortunately, the decrease in percentage fat intake was more than compensated with an increased intake of carbohydrate that was predominantly refined starches and sugars (Nielsen. 2003)." (Yancy. 2013)
"You told me to eat more protein and this burger has both meat and cheese!" - This and other mishaps are the reasons why calories still count in the books of most dietitians - read more about "What Really Happens When Science Meets Real Life"

"[t]hese results suggest that obese individuals did not, as one would expect from our current understanding of maintenance energy requirements, consume more energy than their underweight/normal weight peers, nor did they consume diets that were dramatically different in macronutrient content. [...] For example, using an equation commonly used for calculating energy requirements, a 45-year-old sedentary man of average height (1,78 m) who weighed 70 kg (BMI=22.0 kg/m²) would require 9606 kJ/d to maintain that weight; a man of the same age, height and activity level who weighed 120 kg (BMI=38.0 kg/m²) would require 12.962 kJ/d, a difference of ~3347 kJ/d. This contrasts with the finding in the current study that adjusted energy intakes in the lowest and highest BMI classes differed by only 209–1255 kJ/d in each of the surveys" (Yancy. 2013)And while Yancy et al. mention under-reporting and (this is a certain plus of the study) acknowledge that you can lose fat with both high carb and low carb diets, they miss one very import point, which is the vicious cycle of obesity induced metabolic malfunction. Once you are fat chronic inflammation, insulin resistance, the inability to exercise properly, depression and all the other miseries will help hamper your bodies natural weight regulation mechanisms and you end up gaining weight even if your dietary records are not flawed and you are actually eating less than you would theoretically need if you were a healthy 120kg man with a normal body fat content somewhere in the 14-18% range
 |
| I guess most of you will probably recognize these experts. No matter whom of the two you pick, if you follow his advice like a Lemming you will end like one. Whether it's Taubes' "Exercise will just make you hungry" (read more about the fallacy of this position) or Dr. Oz's mainstreamed diet advice. |
So one answer to the question "Why do we get fat?" would be: "Since we pose the wrong questions, rely on the wrong answers and are too lazy and fainthearted to take our health into our own hands."
I guess that's not a popular answer, but there would not be a SuppVersity, if I did not truly believe that educating yourself and taking your health into your own hands, with the help, but not in blind obedience to the advice, counseling and experience of other, is was the answer to question that's of much greater importance to each of you, namely "How do I manage to stay healthy, happy and lean?"
References:
- Austin GL, Ogden LG, Hill JO. Trends in carbohydrate, fat, and protein intakes and association with energy intake in normal-weight, overweight, and obese individuals: 1971-2006. Am J Clin Nutr. 2011 Apr;93(4):836-43.
- Ballard-Barbash R, Graubard I, Krebs-Smith SM, Schatzkin A, Thompson FE. Contribution of dieting to the inverse association between energy intake and body mass index. Eur J Clin Nutr. 1996 Feb;50(2):98-106.
- Nielsen SJ, Popkin BM. Patterns and trends in food portion sizes, 1977-1998. JAMA. 2003 Jan 22-29;289(4):450-3.
- Romieu I, Willett WC, Stampfer MJ, Colditz GA, Sampson L, Rosner B, Hennekens CH, Speizer FE. Energy intake and other determinants of relative weight. Am J Clin Nutr. 1988 Mar;47(3):406-12.
- Yancy WS, Wang CC, Maciejewski ML. Trends in energy and macronutrient intakes by weight status over four decades. Public Health Nutr. 2013 Jan 16:1-10.


